score.js
open source math
score =
  0.50 * percentile(today, 90d)
+ 0.30 * momentum(change_1d)
+ 0.20 * accel(avg7d / avg30d)
No black box
Three public inputs. Recompute it yourself.
COMINGSOON
where the FOMO gets a number.
From dead to extreme, read the whole market in one glance.
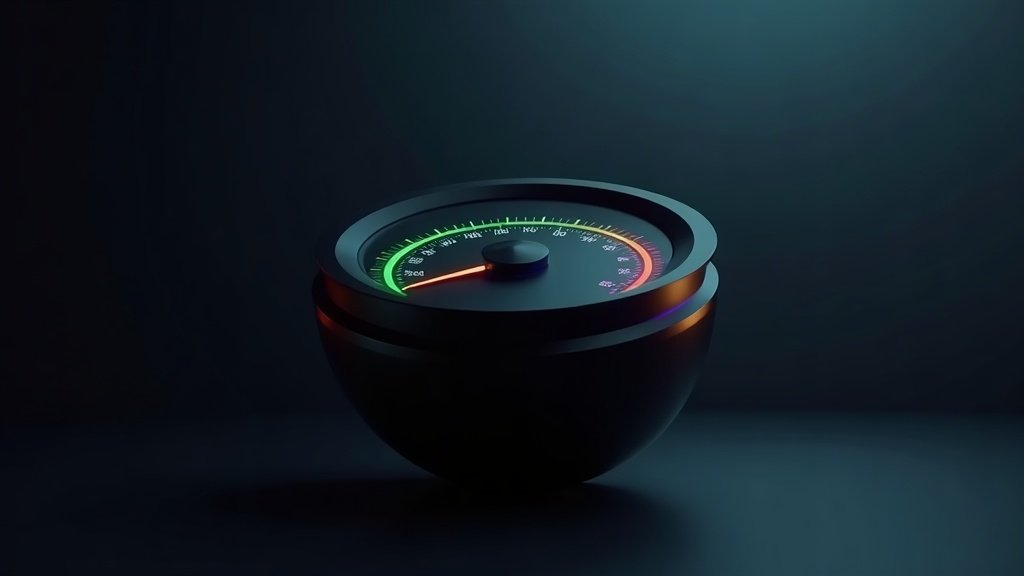
--
LOADING
—
Days of history
score = 0.50 * percentile(today, 90d) + 0.30 * momentum(change_1d) + 0.20 * accel(avg7d / avg30d)
Three public inputs. Recompute it yourself.
Last 30 days
—
Chains measured

percentile  --
momentum    --
accelerate  --
Zero to a hundred, nothing to interpret.
Above 80
the page turns red
"You are the exit liquidity." Every other tool is built to make you buy. This one is built to tell you when you're late.
The bands:
Real daily fee flow through fomo, straight from the chain. No cherry-picking, no rounding in our favour.
fomo · daily fees
Fomometer · Live

Three signals, weighted and recomputed every minute from public chain data. Nothing is smoothed to look good, nothing is hidden behind an API key.
score = 0.50 × percentile(today, last 90d)
      + 0.30 × momentum(change_1d, clipped −50%…+100%)
      + 0.20 × acceleration(avg 7d ÷ avg 30d)
Read the needle, close the tab. No login, no wallet.
Recomputed every minute while the market moves.
Fees, perps and token flow, read from the chain itself.
What every other tool refuses to tell you
You see a green candle and a loud timeline, and you have no idea whether that is the start of something or the end of it.
Terminal here, chart there, timeline somewhere else. By the time you have assembled a picture, the move is already over.
Fomometer collapses fee flow, momentum and acceleration into a single reading — and turns the room red when you are late.
The meter, the dashboard and the token table are free for everyone, with no wallet and no login. What ships next is listed here — nothing is promised as done before it is.
Contract address
COMINGSOON
The Meter
Gauge + live fee data
Most traded
Buy pressure per token
Router indexer
Attribute trades to fomo itself
Alerts
Threshold + token alerts
Launch
TBA